
3.7. Optional Diagnostics and Network Statistics
3.7. Optional Diagnostics and Network Statistics
In particular at faster line rates, diagnosing network protocol issues can be costly, time-consuming and challenging. Therefore, MLE NPAP comes with specialized diagnostics blocks, providing a powerful suite of tools for in-depth network analysis and efficient troubleshooting of network behavior. These diagnostics offer TCP/UDP/IPv4 layer-specific visibility of counters and status information similar to those in Linux or Windows, for example:
- TCP Core Activity: Track performance and network usage of individual cores.
- TCP Peer Balance: Monitor data flow and identify peer misconfigurations.
- Buffer Optimization: Fine-tune buffer settings using diagnostic data and RTT.
- General Troubleshooting: Track packets, errors, and pinpoint issue sources.
MLE NPAP’s diagnostics blocks are accessed using AXI4-Lite and enable efficient diagnosis and a faster path towards resolving network problems when using hardware acceleration.
3.7.1. Diagnostics Data Acquisition Modes
The MLE NPAP diagnostics system supports multiple data acquisition modes to cater to different debugging and analysis needs. These modes define how the underlying counter and event state registers are updated. The selected mode applies universally to all readable counter and event state registers within the respective diagnostics block:
Continuous Mode
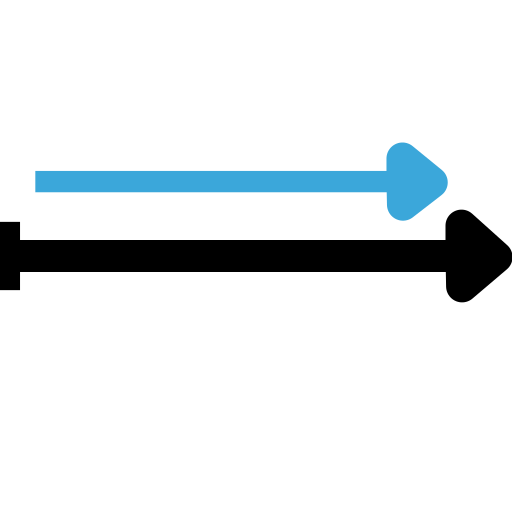
Registers the current state of events and counters every clock cycle. This mode provides the most immediate, real-time data feedback.
Use Case: Ideal for live monitoring of instantaneous activity and quick verification of data paths.
Note: Reading multiple diagnostics registers in quick succession may lead to incoherent data, as the values reflect different, continuous points in time.
Snapshot Mode

Takes an instantaneous, synchronous snapshot of all counter and event states upon a user-triggered write to the control register. The resulting data set is coherent across all registers.
Use Case: Essential for event-driven debugging where you need a single, consistent state of the system immediately following a critical event.
Window Mode
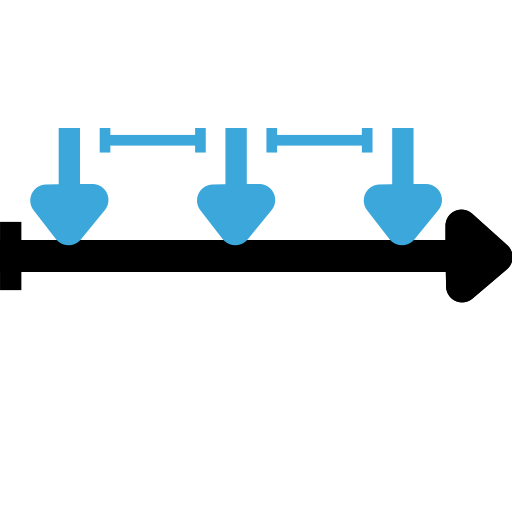
Automatically takes periodic snapshots of the current state of events and counters at user-defined time intervals.
Use Case: Perfect for long-term performance trending, resource analysis, and historical comparison where you need to track changes over defined time segments.
3.7.2. Network Diagnostics Resource Costs
For better design visibility and for gathering network statistics and diagnostics MLE NPAP has the option to spend additional FPGA resources.